- Adways Advent Calendar 3日目の記事です。
http://blog.engineer.adways.net/entry/advent_calendar/archive
こんにちは、大野です。
皆さん去年、国が行った国勢調査を覚えていますか?
5年ごとに行なわれている、国勢調査ですが実はこのデータある程度公開されているのです。
政府統計の総合窓口 GL01010101
こちらのページなのですが、他にもたくさんの統計データが公開されています。
主要な統計から探す 政府統計の総合窓口 GL02100101
さてこの中で地図情報と、エリアごとの人口分布や労働力などのデータが取得できるところがあります。
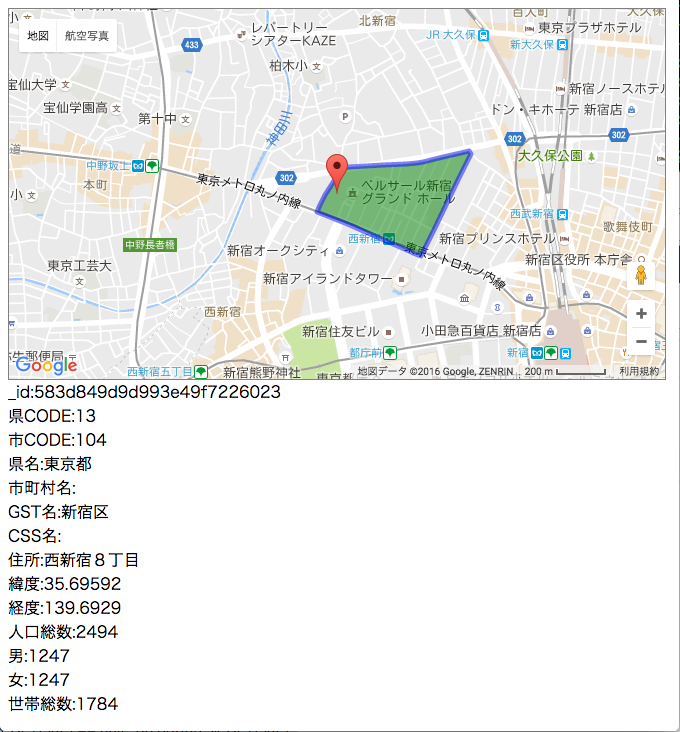
今回はここをGoogleMapに表示して、エリアごとのデータが見れる物を作りたいと思います。
1.データダウンロード
1.上記URLを開く
2.「平成22年国勢調査(小地域) 2010/10/01」を選択
3.「男女別人口総数及び世帯総数」を選択
4.「統計表各種データダウンロードへ」を押す
5.「都道府県」で対象の都道府県を選ぶ
6.「市区町村 (複数選択可)」を選択
7.「検索」ボタンを押す
8.「世界測地系緯度経度・Shape形式」 と「世界測地系緯度経度・GML形式」のzipファイルをダウンロード
まずはこれを全都道府県の全市町村分行うのですが、手作業では非常に大変です。
そこでAPI的なものがないか、くまなくページ内を探したところ
Service Web サービス
ありました。
都道府県取得->GetDownloadStep3CityListTag
統計データzipファイル先取得用->GetDownloadStep4ListTokeiTag
のようなので、まずはGetDownloadStep3CityListTagから行っていきます。
私は今はrubyしか書いてないですが、もともとPHPerなのでPHPで書いてみました。
<?php

function curl($p) {
    $POST_DATA = array(
        'censusId' => 'A002005212010',
        'chiikiName' => $p
    );
    $curl=curl_init("http://e-stat.go.jp/SG2/eStatGIS/Service.asmx/GetDownloadStep3CityListTag");
    curl_setopt($curl,CURLOPT_POST, TRUE);
    curl_setopt($curl, CURLOPT_POSTFIELDS, http_build_query($POST_DATA));
    curl_setopt($curl,CURLOPT_COOKIEJAR,      'cookie');
    curl_setopt($curl,CURLOPT_COOKIEFILE,     'tmp');
    curl_setopt($curl,CURLOPT_FOLLOWLOCATION, TRUE);

    $output= curl_exec($curl);

    return $output;
}
$pref = array(
    '北海道',
    '青森県',
    '岩手県',
...
        '宮崎県',
    '鹿児島県',
    '沖縄県'
);
foreach ($pref as $p) {
    $array = json_decode(json_encode(simplexml_load_string(urldecode(htmlspecialchars_decode(curl($p))))),TRUE);
    foreach ($array["option"] as $value) {
        $d = explode(" ", $value);
        echo $d[0] .":".  $d[1]. "\n";
    }
}
こんな感じで取得したjsonをparseします。
<市町村コード:市町村名>のデータが出来上がるかと思います。
次にGetDownloadStep4ListTokeiTagからリンクを取得します。
onclickの中にdodownload関数が書かれているのですが、ここを取得します。
<?php

$stats = array('T000572');
function curl($p, $f, $s) {
        $POST_DATA = array(
                'censusId' => 'A002005212010',
                'statIds'  => $s,
                'cityIds'  => $p,
                'forHyou'  => $f
        );
        $curl=curl_init("http://e-stat.go.jp/SG2/eStatGIS/Service.asmx/GetDownloadStep4ListTokeiTag");
...
}

while(!feof(STDIN)) {
    if(feof(STDIN)) {
         break;
    }
    $datas = explode(":", trim(fgets(STDIN)));

    foreach($stats as $s) {
        $xml       = urldecode(htmlspecialchars_decode(curl($datas[0], 'true', $s)));
        $pattern = '/<a onclick="([^\"]+)" href="#">/';
        preg_match($pattern, $xml, $m);
        file_put_contents("./dodownload_${s}.txt", $datas[1]. "\t". $m[1]."\n", FILE_APPEND | LOCK_EX);
    }

    $xml       = urldecode(htmlspecialchars_decode(curl($datas[0], 'false', 'T000572')));
    $pattern = '/世界測地系緯度経度・GML形式<\/td><td class=\'tdw35p\'><a onclick="([^\"]+)" href="#">/';
    preg_match($pattern, $xml, $m);
    file_put_contents("./dodownload_GML.txt", $datas[1]. "\t". $m[1]."\n", FILE_APPEND | LOCK_EX);
}
これでdodownload_***とdodownload_GML.txtファイルができたかと思います。
dodownloadはzipファイルをダウンロードしているjavascriptのようなので
これをPHPで書き直してdownloadfileのAPIを実行してzipファイルをダウンロードします。
<?php

$stats = array('T000572');
function dodownload($pdf,$id,$type,$tcode,$acode,$ccode) {
    $POST_DATA = array(
        'state' => '',
        'pdf'  => $pdf,
        'id'  => $id,
        'cmd'  => "D001",
        'type'  => $type,
        'tcode'  => $tcode,
        'acode'  => $acode,
        'ccode'  => $ccode,
    );
    $curl=curl_init("http://e-stat.go.jp/SG2/eStatGIS/downloadfile.ashx");
...
}
if (!is_dir('./datas/zip')) mkdir('./datas/zip', 0755, TRUE);

foreach($stats as $s) {
    $fileData = file_get_contents("./dodownload_${s}.txt");
    $lines = explode("\n", $fileData);
    foreach($lines as $line) {
        $datas = explode("\t", $line);
        if (count($datas) < 2) continue;

        $str = "";
        $cmd = '$str = '.$datas[1];
        eval($cmd."\n");
        file_put_contents("./datas/zip/${s}_${datas[0]}.zip", $str);
    }
}
これでダウンロードは完了しました。
2.データ生成
地図といえばMongoなので、MongoDBを使います。 地図系のindexが張りやすいのが特徴だと思っています。 先ほどのzipファイルを解凍していきます。 unzipはたくさんサンプルででくるためソースは割愛します。
次に必要なデータだけを抽出します。 デフォルト値だとpcreがエラーを吐くのであげる必要があります。
ini_set("memory_limit","1024M");
ini_set("pcre.backtrack_limit", 30000000); // デフォルトは100000
ini_set("pcre.recursion_limit", 30000000); // デフォルトは100000

$statsTitle = array(':KEN', ':CITY', ':KEN_NAME', ':SITYO_NAME', ':GST_NAME', ':CSS_NAME', ':MOJI', ':X_CODE', ':Y_CODE', ':KEYCODE2',':posList');
function parse($html, $statsTitle) {
    $return = "";

    preg_match_all('/<([a-z0-9\-]+)(.*?)>((.*?)<\/\1\2>)?/s', $html, $m);
    $out = array();
    if (count($m[0]) != 0){
        for ($t=0; $t < count($m[0]); $t++){
            if ($m[2][$t] == ':featureMember') $return .= "\n";
            if (in_array($m[2][$t], $statsTitle)) $return .= trim($m[4][$t]).",";
            if ($m[1][$t] == 'gml' && ($m[2][$t] == ':featureMember' || $m[2][$t] == ':surfaceProperty' || $m[2][$t] == ':patches' || $m[2][$t] == ':PolygonPatch' || $m[2][$t] == ':exterior'  || $m[2][$t] == ':LinearRing')) $return .= parse($m[4][$t], $statsTitle);
        }
    }

    return $return;
}

if (!is_dir('./datas/gml')) mkdir('./datas/gml', 0755, TRUE);
$dir = opendir( './datas/zip/' );
while( $file_name = readdir( $dir ) ){
    if ($file_name == '.' || $file_name == '..') { continue; }

    $info = pathinfo('./datas/zip/'.$file_name);
    if ($info['extension'] != 'gml') { continue; }

    $html = file_get_contents('./datas/zip/'.$file_name);
    $o = parse($html, $statsTitle);

    $fp = fopen("./datas/gml/".$file_name, "w");
    fwrite($fp,"$o");
    fclose($fp);
}
closedir( dir );
MongoDBにデータを入れます。 PHP7からはcomposerを使うようです。
<?php
ini_set("memory_limit","2048M");
ini_set("pcre.backtrack_limit", 30000000); // デフォルトは100000
ini_set("pcre.recursion_limit", 30000000); // デフォルトは100000

require_once dirname(__FILE__) . '/vendor/autoload.php';
$mongo = new MongoDB\Client("mongodb://localhost:27017");
$db = $mongo->selectDatabase('geo');

if (!is_dir('./marge')) mkdir('./marge', 0755, TRUE);

$dir = opendir( './datas/gml/' );
while( $file_name = readdir( $dir ) ){
    if ($file_name == '.' || $file_name == '..') { continue; }

    //GMLData
    $gml = file_get_contents('./datas/gml/'.$file_name);
    $g = explode("\n", $gml);

    $fname = str_replace("h22ka", "", $file_name);
    $fname = str_replace(".gml", "", $fname);

    //T000572=男女別人口総数及び世帯総数
    $t000572 = file_get_contents('./datas/zip/tblT000572C'.$fname.'.txt');
    $t000572 = mb_convert_encoding($t000572, "UTF-8", "SJIS");
    $t000572_data = explode("\r\n", $t000572);

    //Marge
    foreach($g as $line) {
        $datas = array();

        $gml_datas = explode(",", $line);
        if (count($gml_datas) < 9) continue;

        $saveData = array();
        $saveData['KEN'] = $gml_datas[0];
        $saveData['CITY'] = $gml_datas[1];
        $saveData['KEN_NAME'] = $gml_datas[2];
        $saveData['SITYO_NAME'] = $gml_datas[3];
        $saveData['GST_NAME'] = $gml_datas[4];
        $saveData['CSS_NAME'] = $gml_datas[5];
        $saveData['MOJI'] = $gml_datas[7];
        $saveData['LAT'] = $gml_datas[9];
        $saveData['LNG'] = $gml_datas[8];

        $pos  = explode(" ", $gml_datas[10]);
        $num = 0;
        $lat    = null;
        $lng   = null;
        $coordinatesArray = array();
        foreach($pos as $p) {
            $num++;
            if (($num % 2) == 1) {
                //緯度
                $lat = $p;
            } else {
                //経度
                $lng = $p;
            }

            if ($lat != null && $lng != null) {
                $coordinate = array(floatval($lng), floatval($lat));
                array_push($coordinatesArray, $coordinate);
                $lat = null;
                $lng = null;
            }
        }
        $saveData['GEO'] = array(
            'type' => 'Polygon',
            'coordinates' => array($coordinatesArray),
        );
        $key = $gml_datas[0].$gml_datas[6];
        $datas['t572'] = getData($t000572_data, $key);
        $saveData['ZINKOUSOUSUU'] = $datas['t572'][0];
        $saveData['ZINKOUOTOKO'] = $datas['t572'][1];
        $saveData['ZINKOUONNA'] = $datas['t572'][2];
        $saveData['ZINKOUSETAI'] = $datas['t572'][3];

        $coll = $db->selectCollection('Area');
        $coll->insertOne( $saveData );
    }
    $count++;
}
MongoDBのIndexを作成します。 今回はgeoテーブルのAreaコレクションを作成したので、そこのGEOにはります。
# mongo
> use geo
> db.Area.createIndex( { GEO:"2dsphere" } )
3.GoogleMapに表示する
ここは何も考えずにGoogleMapのAPIを叩くだけになります。
require_once dirname(__FILE__) . '/vendor/autoload.php';

$lat = $_GET['lat'] == null? 35.69609: $_GET['lat'];
$lng = $_GET['lng'] == null? 139.69039: $_GET['lng'];

$label = '';
$label = '_id,県CODE,市CODE,県名,市町村名,GST名,CSS名,住所,緯度,経度,人口総数,男,女,世帯総数';
$labelArray = explode(',', $label);

$mongo = new MongoDB\Client("mongodb://localhost:27017");
$db = $mongo->selectDatabase('geo');
$coll = $db->selectCollection("Area");

$query = array('GEO'=>array('$geoIntersects'=>array('$geometry'=>array('type'=>'Point', 'coordinates'=>array(floatval($lng), floatval($lat))) )));
$docs = $coll->find($query);

$geodata = '';
$renderdata = '';
foreach ($docs as $id => $obj) {
    $dataArray = array();
    foreach ($obj as $k=>$v) {
        if ($k == "GEO") {
            if (array_key_exists('coordinates', $v)) {
                foreach($v['coordinates'] as $geoArray) {
                    foreach($geoArray as $gk=>$gv) {
                        $geodata .= " new google.maps.LatLng(".$gv[1].", ".$gv[0]."),\n";
                    }
                }
            }
        } else {
            $dataArray[] = $v;
        }
    }
    foreach ($dataArray as $k=>$data) {
        $renderdata .= $labelArray[$k].":".$data."</br>\n";
    }
}
if (strlen($geodata) >= 2) {
    $geodata = substr($geodata, 0, -2);
}
render($lat, $lng, $renderdata, $geodata);

function render($lat, $lng, $data, $geo) {
    echo <<<HTML
<!DOCTYPE html PUBLIC "-//W3C//DTD HTML 4.01 Transitional//EN">
<html>
<head>
    <title>国勢調査 Map</title>
    <meta http-equiv="content-type" content="text/html; charset=utf-8" />
    <script src="http://www.google.com/jsapi"></script>
    <script>google.load("jquery", "1");</script>
    <script type="text/javascript" src="http://maps.google.com/maps/api/js?sensor=false"></script>
    <script type="text/javascript">
        var polygonObj = null;
        var mapObj = null;
        var markerObj = null;
        google.maps.event.addDomListener(window, 'load', function()
        {
            var lng = ${lng};
            var lat = ${lat};

            var mapOptions = {
                zoom: 15,
                center: new google.maps.LatLng(lat, lng),
                mapTypeId: google.maps.MapTypeId.ROADMAP,
                scaleControl: true
            };
            mapObj = new google.maps.Map(document.getElementById('gmap'), mapOptions);

            // 作成するポリゴン外枠座標の配列
            var points = [${geo}];
            // ポリゴンのオプションを設定
            var polygonOptions = {
                path: points,
                strokeWeight: 5,
                strokeColor: "#0000ff",
                strokeOpacity: 0.5,
                fillColor: "#008000",
                fillOpacity: 0.5
            };

            // ポリゴンを設定
            polygonObj = new google.maps.Polygon(polygonOptions);
            polygonObj.setMap(mapObj);

            //マーカー
            var latlng = new google.maps.LatLng(lat, lng);
            markerObj = new google.maps.Marker({
                position: latlng,
                map: mapObj
            });

            // マップクリックイベントを追加
            google.maps.event.addListener(mapObj, 'click', function(e)
            {
                //削除処理
                polygonObj.setMap(null);
                markerObj.setMap(null);

                // ポジションを変更
                markerObj.position = e.latLng;

                // マーカーをセット
                markerObj.setMap(mapObj);

                //reload
                window.location.href = "/polygon.php?lat="+e.latLng.lat()+"&lng="+e.latLng.lng();
            });

        });
    </script>
</head>
<body>
    <div id="gmap" style="width: 99%; height: 370px; border: 1px solid Gray;">
    </div>
    <div id="datas">${data}</div>
</body>
</html>
HTML;
}
Webページを開くと良い感じに表示されるかと思います。
デフォルトの緯度経度はアドウェイズ本社がある場所を指定してみました。

今回は取得しませんでしたが、年齢別や年収別など様々な分類ごとの統計が取得できるので見ているだけで楽しいですね!
次は久保田くんの記事です!